05 / 06 Deep Learning

Machine
Learning
Models

Overview

Background &
Objective

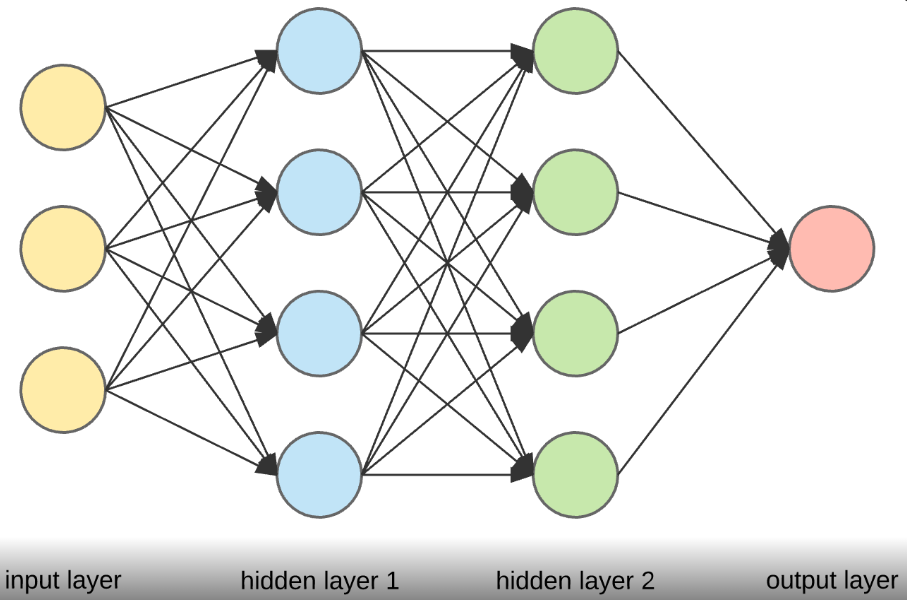
These three Problem Based Learning projects explore complementary neural network architectures, each tackling a distinct domain. Two studies address the same regression challenge Tabular Regression (Healthcare Analytics) predicting medical insurance charges from emographic and health factors using a Multi-Layer Perceptron (MLP). The primary objective is to develop a predictive model that estimates insurance charges based on various demographic and health-related factors such as age, bmi, smoking status, and region. The Radial Basis Function (RBF) model, a powerful machine learning approach, is used to train and predict insurance costs by capturing complex patterns in the data., allowing a direct architectural comparison on identical data.

The third study shifts to computer vision: a custom Convolutional Neural Network (CNN) trained from scratch to classify coastal objects that are shells versus pebbles working across a dataset of over 4,000 labelled images. Developed the CNN model for binary image classification, trained on a dataset containing two distinct image categories. The model achieved a training accuracy and a validation accuracy demonstrating its ability to learn meaningful patterns from image data and generalize to unseen samples with minimal overfitting. Together, the three projects cover the breadth of supervised ML, from tabular regression to image classification.

All models were trained, evaluated, and documented end-to-end: dataset preprocessing, architecture design, training runs, and performance analysis against standard metrics (MSE, R², accuracy, precision/recall). The common thread is understanding how different inductive biases, dense layers, kernel transformations, and spatial convolutions shape what a model learns and how well it generalises.

  • Year2024 - 2025
  • TypeProblem Based Learning (PBL)
  • Team6 Members
  • GuideDr. Rashmi P. Shetty
  • DatasetsKaggle · Medical Insurance & Coastal Images
  • StackPython · Scikit-learn · TensorFlow · Keras
  • InstituteNMAM Institute of Technology, NITTE
Vision-Guided Fruit Collection Robot
86.7%
MLP Train R²
86.8%
RBF Train R²
86.1%
CNN Train Acc.
4,284
CNN Image Samples
The Studies

Three
architectures

Regression · Tabular
01
MLP Regressor
Medical Insurance Cost Prediction

A Multi-Layer Perceptron with three hidden layers (200→100→50 neurons, ReLU activation) trained to predict insurance charges from age, BMI, smoking status, children count, sex, and region. Input encoded via Label Encoding, normalised with Min-Max Scaler. Trained for 2,000 iterations with backpropagation. The combined use of RBF feature mapping alongside MLP helped capture complex non-linear patterns in the tabular data.

Train R² 86.73%
Test R² 84.27%
Train MSE 0.00488
Test MSE 0.00622
Regression · Kernel
02
RBF Kernel Regressor
Medical Insurance Cost Prediction

A Radial Basis Function network implemented via Kernel Ridge Regression (α=0.001, γ=0.08), enhanced with K-Means feature engineering (45 clusters, Elbow Method). The RBF kernel K(x,x') = exp(−γ|x−x'|²) maps inputs to a higher-dimensional space, improving class separability. StandardScaler normalisation and 80/20 train-test split. Smoking status emerged as the dominant predictor (correlation 0.79 with charges).

Train R² 86.79%
Test R² 85.78%
Train MSE 0.1301
Test MSE 0.1506
Classification · Vision
03
CNN Classifier
Shells vs. Pebbles Image Classification

A custom three-layer CNN (Conv2D 32→64→128, 3×3 kernels, ReLU + MaxPooling) built from scratch in TensorFlow/Keras for binary image classification. Trained on 4,284 images (150×150px) with a 80/20 split. Dropout(0.5) for regularisation, Adam optimiser, binary cross-entropy loss. 10 epochs. Pebble class achieved F1=0.82; Shell class F1=0.62, reflecting class imbalance (548 pebbles vs 308 shells in validation).

Train Accuracy 86.14%
Val Accuracy 75.47%
Pebbles F1 0.82
Shells F1 0.62
Cross-Study Insight

The two regression models reach near-identical R² scores (~86.7-86.8% training) on the same insurance dataset, but with very different learning mechanisms. The RBF model generalises slightly better (test R² 85.78% vs 84.27%), suggesting kernel methods may be more robust to the non-linear smoker-charge relationship that dominates this dataset. The CNN's ~11% train-to-val gap signals room for improvement via data augmentation or transfer learning.

Comparison

Side-by-side
breakdown

Attribute MLP Regressor RBF Regressor CNN Classifier
Task Regression Regression Classification
Data Type Tabular (6 features) Tabular (6 features) Images 150×150px
Dataset Size 1,338 rows 1,338 rows 4,284 images
Normalisation Min-Max Scaler Standard Scaler Rescale ÷ 255
Architecture 3 hidden layers, 200-100-50 KRR + 45 K-Means clusters 3× Conv2D + MaxPool + Dense
Activation ReLU (hidden), Linear (out) RBF Kernel (γ=0.08) ReLU + Sigmoid (out)
Regularisation Iterations limit (2000) Ridge α=0.001 Dropout 0.5
Train Score R² 86.73% R² 86.79% Acc. 86.14%
Test / Val Score R² 84.27% R² 85.78% Acc. 75.47%
Key Strength Flexible depth Better generalisation Spatial feature learning
Tech Stack

Built with

Python Scikit-learn TensorFlow Keras NumPy Pandas Matplotlib Seaborn Kernel Ridge Regression K-Means Clustering Label Encoding ImageDataGenerator
Feature Importance
Across both insurance regression models, smoking status showed the highest correlation with charges (0.79), followed by age (0.30) and BMI (0.20). Region was near-uncorrelated (-0.01), suggesting it could be dropped without model degradation.
RBF vs MLP Generalisation
The RBF model achieved a higher test R² (85.78%) vs MLP (84.27%), despite near-identical training scores. The kernel method's implicit regularisation via ridge penalty and radial distance decay produced a slightly smoother decision surface.
CNN Class Imbalance
The validation set contained 548 pebble images vs 308 shell images. This imbalance contributed to the lower shell F1-score (0.62 vs 0.82 for pebbles). Weighted sampling or augmentation would likely close this gap in future iterations.
New Data Validation (MLP)
Manual validation on 5 new insurance records (age 25-60, mixed smoking) showed predictions within 10% tolerance for all 5 cases, with the highest deviation at 5.45% for a non-smoking 35-year-old female confirming practical usability.
Source Code & Notebooks
Explore
on GitHub
View on GitHub ← All Projects